
Anúncios
Finding the right tools to test your WiFi speed and analyze network performance has become essential for both home users and IT professionals seeking reliable internet connectivity.
Modern WiFi analyzer apps have transformed how we diagnose connectivity problems, measure bandwidth, and optimize router placement. These applications provide instant insights into network congestion, signal strength, and interference from neighboring networks.
Whether you’re troubleshooting slow downloads, preparing for a video conference, or setting up a new router, understanding which WiFi testing tools deliver accurate results can save hours of frustration and improve your overall internet experience.
📊 Understanding WiFi Speed Test Applications
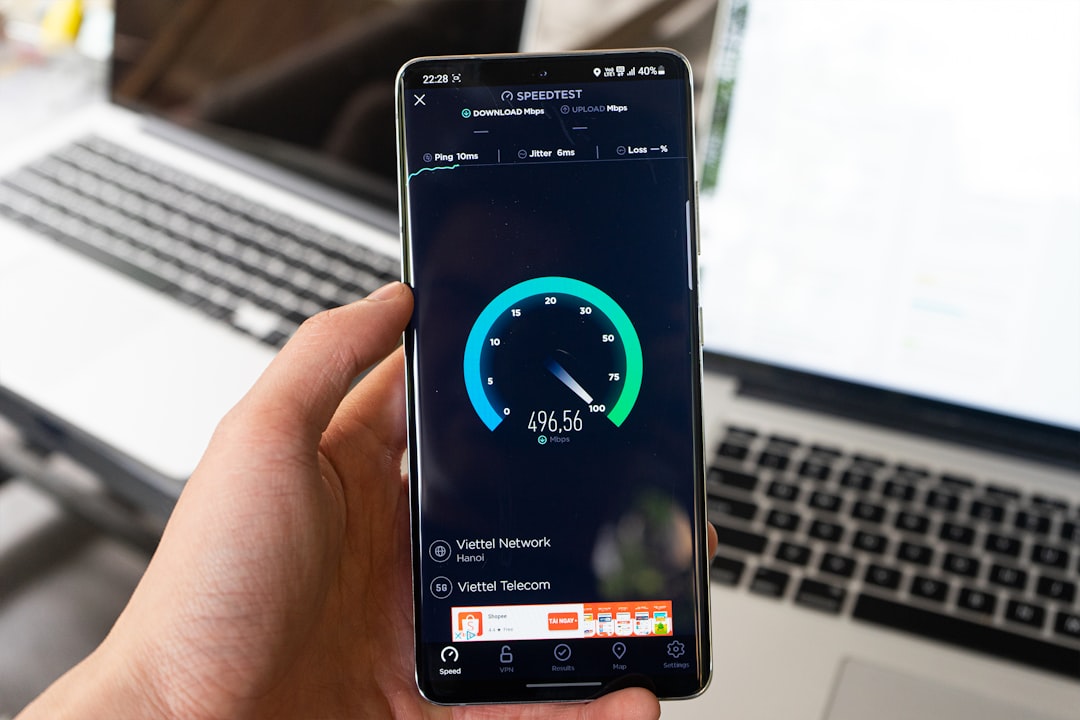
WiFi speed test applications measure the actual throughput between your device and internet servers, revealing the real-world performance of your connection. Unlike the theoretical speeds advertised by internet service providers, these apps show what you’re actually getting.


Most speed test apps measure three critical metrics: download speed (how fast data reaches your device), upload speed (how quickly you can send data), and latency or ping (the delay before data transfer begins). Download speeds typically range from 25 Mbps for basic browsing to 100+ Mbps for 4K streaming and gaming.
The testing process sends packets of data between your device and remote servers, calculating transfer rates in megabits per second (Mbps). Results vary based on server location, network congestion, time of day, and the number of devices sharing your connection.
🎯 Key Features of Professional WiFi Apps
Professional-grade WiFi analyzer apps go beyond simple speed tests. They scan available wireless channels, detect signal interference, identify channel overlap, and map signal strength throughout your space.
Advanced features include heat mapping capabilities that visualize WiFi coverage across floor plans, spectrum analysis to identify 2.4 GHz and 5 GHz band performance, and device discovery tools that show every connected gadget on your network.
- Channel Scanner: Identifies which WiFi channels have the least interference from neighboring networks
- Signal Strength Meter: Displays real-time dBm readings to find optimal router placement
- Network Discovery: Lists all devices connected to your network with IP addresses and MAC addresses
- Speed History: Tracks performance over time to identify patterns and persistent issues
- Server Selection: Allows testing against multiple geographic locations for comprehensive results
🔍 How WiFi Analyzers Diagnose Network Problems
WiFi analyzer applications function as diagnostic tools that reveal hidden network issues affecting your connection quality. They detect problems that standard speed tests miss, such as channel congestion, interference sources, and coverage dead zones.
When you experience buffering, disconnections, or slow speeds, these apps pinpoint whether the problem stems from your router configuration, ISP throttling, device limitations, or environmental interference from microwaves, baby monitors, and other electronics.
📡 Signal Strength and Coverage Mapping
Signal strength measurements expressed in dBm (decibel milliwatts) typically range from -30 dBm (excellent) to -90 dBm (unusable). Professional apps display these values in real-time as you move through your space.
A reading of -50 dBm or better indicates excellent signal quality suitable for bandwidth-intensive activities. Values between -60 and -70 dBm work adequately for general browsing and streaming. Below -70 dBm, you’ll experience slowdowns, and below -80 dBm becomes problematic for most applications.
| Signal Strength (dBm) | Quality Level | Recommended Use |
|---|---|---|
| -30 to -50 | Excellent | 4K streaming, gaming, video calls, large downloads |
| -51 to -60 | Very Good | HD streaming, online gaming, multiple devices |
| -61 to -70 | Good | Standard streaming, browsing, email |
| -71 to -80 | Fair | Basic browsing, may experience slowdowns |
| -81 to -90 | Poor | Unreliable connection, frequent disconnections |

🌐 Channel Overlap and Interference Detection
WiFi networks broadcast on specific channels within the 2.4 GHz and 5 GHz frequency bands. Channel overlap occurs when multiple nearby routers use the same or adjacent channels, creating congestion that slows everyone’s connection.
The 2.4 GHz band offers only three non-overlapping channels (1, 6, and 11 in most regions), making interference common in apartment buildings and dense neighborhoods. The 5 GHz band provides significantly more channels with less overlap, though with shorter range.
Quality analyzer apps display a visual graph showing neighboring networks, their channel assignments, and signal strengths. This information helps you select the least congested channel, potentially doubling your effective speed without any hardware changes.
⚡ Optimizing Internet Performance with Test Results
Speed test results provide actionable data for improving your network performance. Understanding what the numbers mean enables targeted troubleshooting rather than random trial-and-error approaches.
If tests show significantly lower speeds than your ISP plan promises, the problem might be outdated router firmware, too many connected devices, poor router placement, or ISP throttling during peak hours. Each scenario requires different solutions.
🏠 Router Placement Strategies Based on Test Data
Using signal strength readings from a WiFi analyzer, you can scientifically determine optimal router placement. The goal is achieving coverage throughout your space while minimizing interference from walls, metal objects, and electronic devices.
Ideal router locations include central positions on the main floor, elevated mounting (higher than 4 feet), and away from thick walls or metal filing cabinets. Avoid placing routers near microwaves, cordless phones, or in enclosed cabinets that block signals.
Walk through your home or office with the analyzer app open, noting signal strength in each room. Areas showing -70 dBm or weaker need intervention—either repositioning the router, switching to 5 GHz band, or adding a mesh system or WiFi extender.
📈 Interpreting Speed Test Fluctuations
Speed test results naturally vary throughout the day due to network congestion, ISP capacity management, and the number of users in your area online simultaneously. Running multiple tests at different times provides a complete picture.
Morning tests (6-9 AM) typically show faster speeds as fewer people are streaming or gaming. Evening hours (7-11 PM) represent peak usage when speeds often drop 20-40% from advertised maximums. Weekend afternoons also show heavier traffic.
Consistent results below 50% of your plan speed indicate problems requiring ISP contact. Occasional dips during peak hours are normal. Document test results with screenshots showing date, time, and server location when contacting support—evidence accelerates troubleshooting.
🛠️ Advanced Troubleshooting Techniques
When basic optimizations don’t resolve speed issues, advanced diagnostic features in professional WiFi apps reveal deeper problems. These tools separate issues originating from your local network versus problems with your ISP’s infrastructure.
Testing directly connected via Ethernet cable versus WiFi isolates whether wireless interference causes slowdowns. If wired speeds match your plan but wireless speeds lag, the problem lies in your WiFi configuration rather than ISP service.
🔒 Security Analysis and Network Protection
Many WiFi analyzer apps include security scanning features that detect unauthorized devices on your network. Unfamiliar devices consuming bandwidth directly impact your speed and potentially compromise security.
Regular network scans reveal smart home devices you’ve forgotten about, neighbors stealing WiFi through weak passwords, or even malicious devices. Each connected device shares your total bandwidth—10 devices on a 100 Mbps connection theoretically get 10 Mbps each under heavy simultaneous use.
MAC address filtering, stronger WPA3 encryption, and regular password changes prevent unauthorized access. Some advanced apps even alert you when new devices connect, enabling immediate investigation.
⏱️ Latency and Jitter Measurements
Beyond raw speed, latency (ping time) and jitter (latency variation) critically affect real-time applications like video conferencing, online gaming, and VoIP calls. A connection with 100 Mbps download but 200 ms latency feels slower than 25 Mbps with 20 ms latency.
Latency under 20 ms is excellent for gaming and video calls. 20-50 ms works well for most applications. 50-100 ms is noticeable but acceptable. Above 100 ms creates frustrating delays in conversation and gameplay.
Jitter should stay below 30 ms for smooth performance. High jitter causes stuttering video, robotic-sounding audio, and unpredictable lag spikes even when average latency seems acceptable. Quality WiFi apps graph latency over time, revealing patterns that standard speed tests miss.
📱 Choosing the Right WiFi Testing App
Different WiFi analyzer applications target different user needs. Casual home users need simple speed testing and basic troubleshooting. IT professionals require enterprise features like detailed spectrum analysis, multi-device comparison, and exportable reports.
The best app depends on your specific requirements: frequency of use, technical expertise, operating system, and whether you need historical data tracking. Free versions typically provide basic speed tests while paid versions unlock advanced analysis tools.
💡 Essential Features for Home Users
Home users benefit most from intuitive interfaces showing clear speed test results, visual channel congestion displays, and simple recommendations for improvement. Overly technical data creates confusion rather than clarity.
Look for apps that explain results in plain language, offer one-tap testing, save history automatically, and provide actionable tips. Features like notification alerts when speeds drop below thresholds help catch problems early.
- One-tap speed testing with clear download/upload/ping results
- Visual channel recommendations showing which WiFi channel to use
- Coverage heat maps indicating signal strength in different rooms
- Connected device lists with easy device identification
- Historical graphs showing speed trends over days or weeks
🎓 Professional Features for Advanced Users
Network administrators and tech enthusiasts need deeper diagnostic capabilities including spectrum analysis across both frequency bands, packet loss measurement, DNS resolution testing, and the ability to test against custom servers.
Professional apps offer scheduled automatic testing that builds comprehensive performance databases, multi-point comparison showing speed variations between locations, and detailed logs exportable for documentation or ISP disputes.
Advanced tools measure Quality of Experience (QoE) metrics specifically for streaming services, gaming platforms, or video conferencing apps. Rather than generic bandwidth numbers, these tests simulate real application usage and report performance in application-specific terms.
🌟 Maximizing Your Internet Investment
Internet service represents a significant recurring expense—ensuring you receive the speeds you’re paying for protects your investment. Regular testing documents performance and provides leverage when negotiating with providers.
Many users pay for premium speed tiers they never actually receive due to outdated equipment, poor configuration, or ISP overselling of capacity. Systematic testing reveals whether upgrades actually improve performance or simply cost more.
💰 When to Upgrade Your Internet Plan
Speed test history helps determine whether your current plan meets your needs. If tests consistently show you’re maxing out available bandwidth during normal use, an upgrade makes sense. If tests show you’re using only 30% of capacity, you might downgrade and save money.
Calculate your household bandwidth needs based on simultaneous users and activities. Standard definition streaming uses about 3 Mbps per stream, HD requires 5-8 Mbps, and 4K demands 25 Mbps. Add 5 Mbps per person for browsing, email, and social media.
A household with four people streaming HD content simultaneously needs minimum 32 Mbps plus overhead—a 50 Mbps plan would suffice. The same household streaming 4K requires 100+ Mbps plus buffer for multiple devices.
🔧 Hardware Upgrades vs. Plan Upgrades
Before paying for faster internet plans, verify your equipment can handle higher speeds. Many older routers max out at 100 Mbps regardless of your plan. WiFi standards matter: 802.11n handles up to 300 Mbps, 802.11ac manages 1 Gbps+, and 802.11ax (WiFi 6) supports multi-gigabit speeds.
Test with an Ethernet connection directly to your modem to determine if your router is the bottleneck. If wired speeds match your plan but WiFi speeds lag significantly, router replacement solves the problem without plan upgrades.
Similarly, older devices with outdated WiFi chips can’t utilize modern high-speed connections. A five-year-old laptop with 802.11n WiFi won’t benefit from gigabit internet—the device hardware becomes the limiting factor.
🎯 Real-World Application Scenarios
Different situations require different approaches to WiFi testing and optimization. Understanding context-specific challenges helps apply the right solutions efficiently.
🏢 Remote Work and Video Conferencing Optimization
Remote workers depend on stable connections for video calls, cloud applications, and large file transfers. Latency and jitter matter more than raw bandwidth—a 25 Mbps connection with 15 ms ping outperforms 100 Mbps with 80 ms ping for video conferencing.
Position your workspace within strong signal range (better than -60 dBm) and use 5 GHz band when possible for reduced interference. Schedule important calls during off-peak hours if possible, and close bandwidth-heavy applications during video meetings.
Test your connection specifically during typical meeting times—morning performance might differ dramatically from afternoon. Document any recurring issues with timestamps to identify patterns and potential ISP throttling.
🎮 Gaming Performance Tuning
Online gaming demands low latency and minimal jitter more than massive bandwidth. Competitive gaming requires sub-30 ms ping times, while 50-75 ms remains playable for casual gaming. Jitter above 20 ms causes frustrating lag spikes that disrupt gameplay.
Enable Quality of Service (QoS) settings in your router to prioritize gaming traffic over background downloads. Use wired Ethernet connections when possible—WiFi adds 5-15 ms latency compared to wired connections.
Test during your typical gaming hours to identify congestion patterns. If tests show good speeds but poor latency, the problem likely stems from network congestion or routing issues requiring ISP intervention.
🚀 Future-Proofing Your Network Setup
Technology evolves rapidly—today’s adequate speeds become tomorrow’s bottlenecks. Smart WiFi testing and optimization create flexible networks that adapt to changing needs without complete overhauls.
Mesh WiFi systems, WiFi 6/6E routers, and fiber optic internet connections represent the current cutting edge. Regular testing helps determine when these investments make practical sense versus representing unnecessary spending on unused capacity.
The average household adds 3-5 new connected devices annually—smart TVs, security cameras, voice assistants, and smart appliances. Each device consumes bandwidth and creates potential interference. Proactive testing identifies when your network approaches saturation before problems become severe.
Document your network performance quarterly with comprehensive tests covering all rooms, times of day, and connected device scenarios. This baseline data reveals performance degradation over time and justifies upgrades with concrete evidence rather than guesswork.
